Create wordcloud portraits with python
Create wordcloud portraits with python
Create wordcloud portraits with python
This is not a data viz article but an article about creating graphically-interesting art using the wordcloud library in python.
jelena-ristic.medium.com
워드 리스트(또는 문장)과 mask로 사용할 이미지를 넣으면, 이에 맞춰 오른쪽 그림과 같은 결과물을 만드는 방법에 대해 설명한다. 한글을 적용하는 과정에서의 델타사항을 제외한 모든 내용은 원문의 내용을 따랐다.

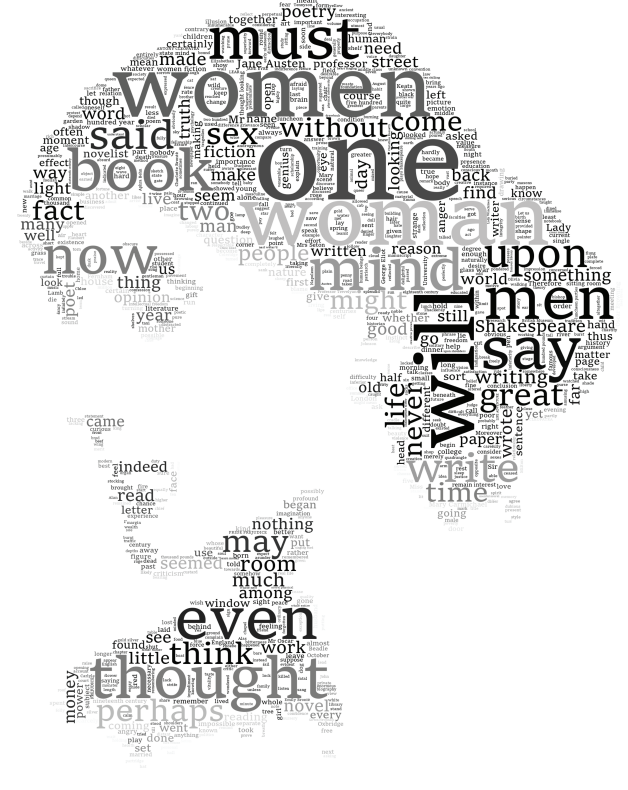
참고 - 위 오른쪽 그림과 같은 결과물을 얻으려면 masking 이미지에 터칭을 해 줘야 한다. 즉, 얼굴에서 눈 부위를 제외한 나머지 부분을 white로 덮어 씌워야 저렇게 이목구비 위주로 표현되게 할 수 있다.
필요한 패키지 설치
pip install wordcloud
소스코드
주피터 노트북을 사용하는 환경을 기준으로 코드가 작성되어 있다.
관련 패키지를 import 한다.
from wordcloud import WordCloud, STOPWORDS, ImageColorGenerator
import matplotlib
import matplotlib.pyplot as plt
plt.rcParams["figure.dpi"] = 2000
import pandas as pd
import numpy as np

from PIL import Image
원하는 문장들을 파일에 담는다.
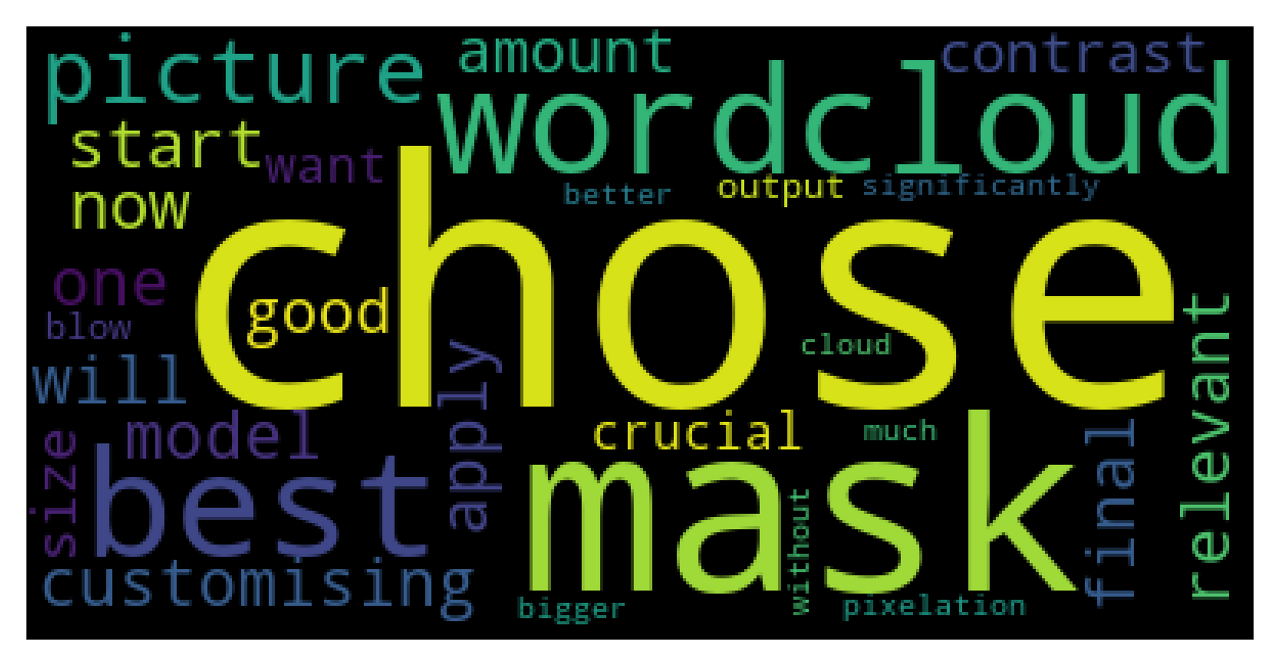
You can now start customising it: chose the relevant mask you will apply to model the final wordcloud. It is best to chose one that has a good amount of contrast to get the best out of your wordcloud, also the mask picture size is crucial if you want to get an output that you can blow up significantly without too much pixelation. The bigger the picture, the better the cloud
논란을 만들고
사회분열을 조장하고
혐오를 생산하고
그걸로 밥벌어먹고 사는 직업
300톤???일반 가정집에 한달에 30톤정도 물을쓴다..
아파트 열집만 돌리면 끝날 적은양임..
공짜???
수자원공사에 돈 따박따박내고
애시당초 우리나라는 물부족국가도 아니고
그냥 뭐 혐오생산글임...
제일 필요한게 배달앱에서 악성후기쓰는놈
조지는 법이랑 되도안한 악성기사 끄는 기자
조지는 법을 만들어야함...
개드립 - 기레기가 현재 이 사회에 존나 해악인 이유.. ( <https://www.dogdrip.net/409779412> )
파일로부터 데이터를 읽어와서 간단하게 word cloud를 만들어 보자.
data = open("words.txt").read()
wordcloud = WordCloud().generate(data)
#and use matplotlib to display generated image
plt.imshow(wordcloud)
plt.axis("off")
plt.show()
- 참고
실행할때마다 random하게 위치가 일부 조정된다.
한글 문장에 대해 워드 클라우드를 만들려면 한글 폰트를 넣으면 된다.
font를 찾지 못하는 경우, 맥의 ‘서체 관리자'에서 폰트 내보내기로 *.ttc 파일을 만들어 소스코드가 위치한 곳과 같은 디렉토리로 이동시킨다.
wordcloud = WordCloud(font_path="NanumMyeongjo.ttc").generate(data)
원문에서는 pd.read_html() 함수를 쓰는 것도 가능하다고는 하지만, 막상 해 보면 갖가지 에러가 뜬다.
data = pd.read_html(input("paste your URL here: "))
요즘 대다수의 웹사이트는 한 페이지에 내용 이외의 잡다한 태그들이 거지같이 달려 있어 분석에 오히려 도움이 안된다.
Mask용 이미지를 준비하자
위에 있는 이미지를 그대로 사용하면, masking이 전혀 먹히지 않는다. 이유는 배경을 white로 날려주지 않아서 그런것이다.
- 배경 날리기 + 흰색으로 바꾸기
- Tips: 화면캡처를 하게되면, Display의 해상도가 높은 경우 지나치게 큰 이미지가 만들어져서 변환이 매우 느려지는 문제가 있으니 주의하자.
- Remove Background from Image - remove.bg
이미지 배경 제거, 투명 배경 만들기 – remove.bg
사진이나 이미지 배경을 한 번 클릭으로 5초만에 무료로 제거할 수 있습니다. 이미지 배경 투명하게 만드는 법. 누끼 따기 프로그램.
www.remove.bg
Mask를 씌워 보자
cloud_mask = np.array(Image.open("portrait-whitebg.png"))
# plt.imshow(cloud_mask)
# plt.axis("off")
# plt.show()

wordcloud = WordCloud(
                      font_path="Monofur for Powerline.ttf", #add your font here
                      width = 2380, # use the same width and height
                                    #as your mask size for best
                                    #results
                      height = 2879,
                      stopwords=STOPWORDS, #if the staple stopwords
                                           #the module provides is
                                           #not good enough, you can
                                           #list your own
                      background_color = "white",
                      mask = cloud_mask,
                      contour_width = 0,
                      repeat=True,
                      min_font_size = 2, #if you want a tight fit,
                                         #go for a small figure here
                      max_words = 1000, #set max words count
                      ).generate(data)
image_colors = ImageColorGenerator(cloud_mask) #use the mask colours
wordcloud.generate(data)
wordcloud.recolor(color_func=image_colors)
결과물을 파일로 저장해보자
plt.axis("off")
plt.imshow(wordcloud)
fig1=plt.gcf()
plt.show()
plt.draw()
fig1.savefig("Woolf.svg", format="svg", bbox_inches="tight")
- 조금 이상한 것이 이 코드를 2개의 셀로 나눠서 실행시키면 이미지 표현/파일 저장이 되지 않는다. 셀을 넘어가면 메모리 scope이 달라지나? 잘 이해가 안가는데..

Future Works
- 웹 서비스로 옮기기
- 아래는 샘플 사이트
- Word Cloud Generator
Word Cloud Generator
www.jasondavies.com
참고자료
- 참고. matplotlib의 imshow를 이용하여 이미지 보여주기
import matplotlib.image as img
import matplotlib.pyplot as pp

fileName = "c:\\\\sample.png"

ndarray = img.imread(fileName)

pp.imshow(ndarray)
pp.show()
- imshow()는 이미지를 만들기만 하는 것이며, show는 화면에 보여주는 것?
- imshow는 원하는 사이즈의 픽셀을 원하는 색으로 채워서 만든 그림
- 쉽게말하면 원하는 크기의 행렬을 만들어서 각 칸을 원하는 색으로 채우는 것
- 각 칸을 채우는 방법은 colormap, RGB, RGBA 의 네가지가 있음
- colormap 디폴트
- colormap 변경방법
- RGB
- RGBA
- plt.gcf()
- figure을 많이 만들어 놓으면 어떤 figure이 있는지 알기 어려워진다.
- 현재 figure를 확인하기 위한 방법으로는 plt.gcf()를 사용한다.
- gcf는 get current figure의 약어.
- https://engineer-mole.tistory.com/215
[python] matplotlib 사용법 기초
matplotlib는 figure이나 subplot등이 어떻게 움직이는지 알기 어렵다. 따라서 이번 포스팅을 통해 matplotlib의 구조에 대해서 간략하게 정리하고자 한다. 포스팅은 내용은 기본적으로 matplotlib.pyplot을 imp
engineer-mole.tistory.com
'오픈소스' 카테고리의 다른 글
| git 명령 몇 가지 - add 취소, branch 생성/전환, commit 취소 (0) | 2022.11.23 |
|---|---|
| 이미지 배경 날리기 (무료 웹서비스 vs 오픈소스) (0) | 2022.11.12 |
| OpenSUSE Linux - Tumbleweed (0) | 2022.11.11 |
| 슬랙의 대체제 Mattermost를 라즈베리파이에 설치하기 (0) | 2022.11.06 |
| Notion의 대체제 AppFlowy (0) | 2022.11.05 |

